Policy spillovers
One of the key known unknowns heading into this year was the extent to which U.S. government policies would shape the macroeconomic landscape. Unfortunately, the policies perceived to be less economically-supportive dominated the narrative in the first quarter, while the potentially more growth-additive policies (e.g., tax cuts, deregulation) were put on the backburner. Specifically, there remains an elevated amount of uncertainty surrounding the outcome of trade policy. In addition to the uncertainty drag, consensus tariff expectations have repriced to levels that resemble the risk case scenario of some initial forecasts.
Beyond trade, policy risk from federal layoffs and reduced immigration have added to growth concerns. The net result has been an unfavorable mix of lower growth and higher inflation expectations incorporated into U.S. consensus estimates. Nonetheless, forecasts for real growth in 2025 exited the quarter around 1.5% and included an expectation for continued easing from the Fed.
While the policy spillover into U.S. forecasts was incrementally negative, more positive developments resulted abroad. At risk of less support from the U.S., Germany executed unexpected fiscal reform that lifts the debt brake for defense spending and includes a €500 billion infrastructure fund. At the same time, China has taken a more proactive approach toward stimulating domestic demand as well as more positively engaging with the private sector. While risk of negative tariff shocks remain high, Europe and China made incrementally positive strides during the quarter.
Good quarter for diversification
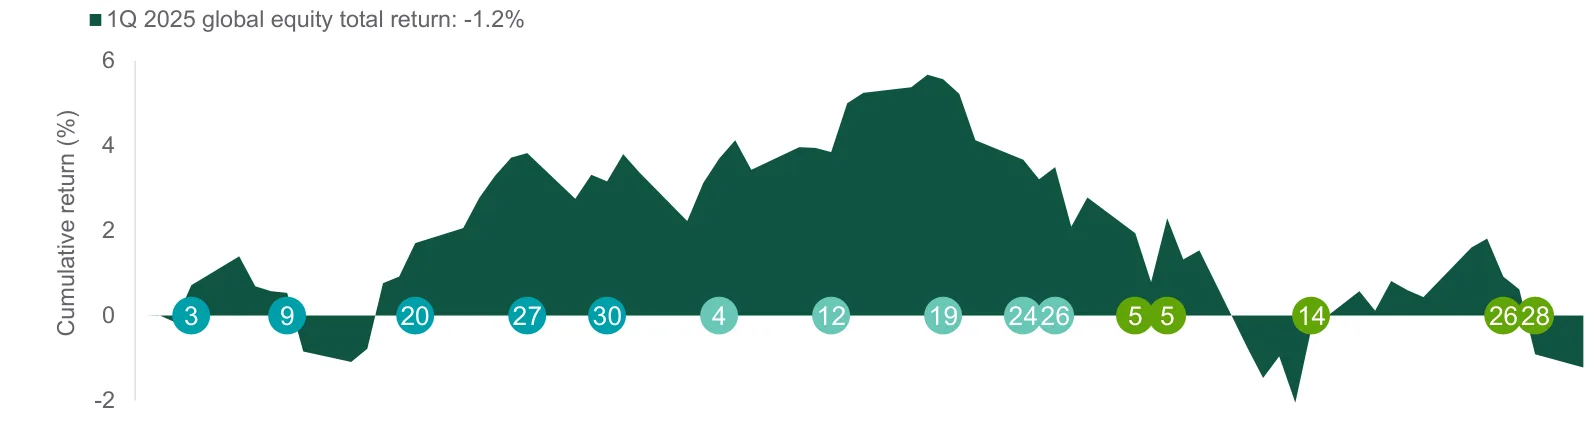
First quarter financial market returns were generally positive aside from losses in U.S. equities. The market backdrop at the onset of the quarter looked quite different from February and March as late-January DeepSeek AI news jolted markets followed by policy uncertainty taking center stage by early February. These impacts were most pronounced in U.S. equities as the S&P 500 quickly corrected by 10% from mid-February through mid-March.
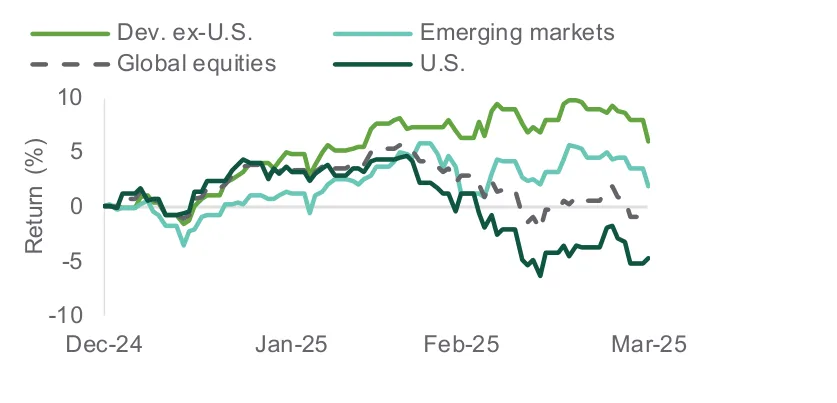
Underlying equity market dynamics shifted with the Magnificent 7 group a large drag (six of the seven were down more than 10%) and more defensive parts of the market leading the way. Despite Mag 7 weakness, broader U.S. equities held up reasonably well with the equal-weighted S&P 500 down only 1% and defensive sectors posting mid-single-digit gains. More notable was the strong performance in Europe and to a lesser extent, emerging markets. Europe equities outpaced the U.S. by about 15% in dollar terms. Both regions benefited from a rebound off a weaker starting point versus the U.S. The historic pivot in German fiscal policy was a major boost for Europe with aerospace & defense companies up 30%-plus for the quarter. For emerging markets, China was a key driver, as heavyweight tech companies were a key source of strength.
On the fixed income side, after rising early on, interest rates moved lower for the quarter while credit spreads widened. This led to modest positive total returns for broader fixed income indexes. Real assets generally outperformed global equities, with stronger performance in natural resources and global listed infrastructure.
First Quarter 2025 Total Returns (%)
Most asset classes ended the quarter modestly higher despite losses in the U.S. equity markets.
| Category | Asset class | Index | 1Q 2025 (%) | 2024 (%) |
|---|---|---|---|---|
| Fixed Income | Cash | Bloomberg 1-3 Month UST | 1.0 | 5.3 |
| Fixed Income | Municipal bonds | Bloomberg Municipal | -0.2 | 1.1 |
| Fixed Income | Investment grade bonds | Bloomberg Aggregate | 2.8 | 1.3 |
| Fixed Income | TIPS | Bloomberg TIPS | 4.2 | 1.8 |
| Fixed Income | High yield bonds | Bloomberg High Yield 2% Capped | 1.0 | 8.2 |
| Fixed Income | Emerging markets debt | JP Morgan GBI-EM Global Diversified | 4.3 | -2.4 |
| Equities | U.S. equities | MSCI U.S. Equities IMI | -4.8 | 23.8 |
| Equities | Developed ex-U.S. equities | MSCI World ex-U.S. IMI | 6.0 | 5.0 |
| Equities | Emerging markets equities | MSCI Emerging Market Equities IMI | 1.8 | 7.6 |
| Real Assets | Natural resources (NR) | S&P Global Natural Resources | 7.1 | -8.3 |
| Real Assets | Global real estate (GRE) | MSCI ACWI IMI Core Real Estate | 1.2 | 3.2 |
| Real Assets | Global listed infrastructure (GLI) | S&P Global Infrastructure | 4.6 | 15.1 |
Source: Northern Trust Asset Management, Bloomberg. NR: Natural Resources; GRE: Global Real Estate; GLI: Global Listed Infrastructure. Indexes are gross of fees. Past performance is not indicative or a guarantee of future results. Index performance returns do not reflect any management fees, transaction costs or expenses. It is not possible to invest directly in any index.
Key Developments
Uncertainty Is the Word of the Day
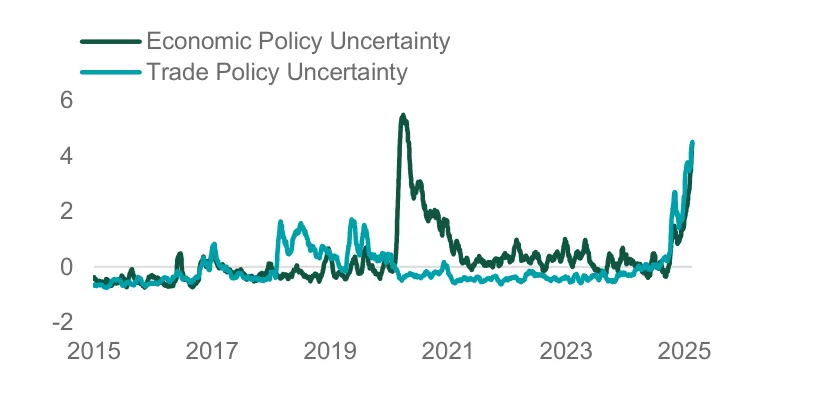
Policy uncertainty was the main surprise for the investor community in the first quarter. Trade policy was the focal point with potential widespread implications for both global trade and geopolitical relations. Trade policy announcements were more severe than expected and multiples of magnitude higher than the 2018 trade episode in Trump’s first term. Adding to complexity, the uncertainty has been multi-layered with regard to the timing, exact policy details, how long policies will remain in place and their ultimate expected economic impact.
Daily Uncertainty Measures: Z-Scores
U.S. Economy Gives Up Some Ground
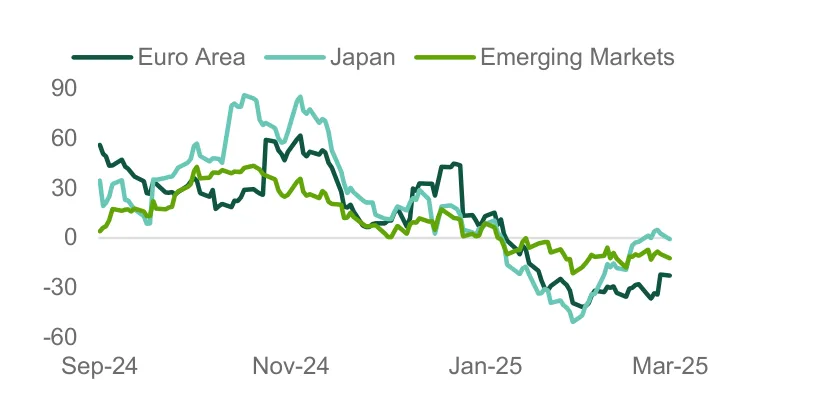
The U.S. economy remained on decent footing in 1Q. However, policy uncertainty weighed on survey-related economic data, with perceived risks around lower growth and higher inflation. This helped lead to fading U.S. economic momentum versus non-U.S. peers – an advantage over the better part of the last two years. While soft data can be overly influenced by recent events and is not necessarily predictive, key questions remain around how lower confidence translates to economic activity via consumer and corporate behavior.
Citi Economic Surprise Index: U.S. Versus…
Central Banks Still Cutting Rates
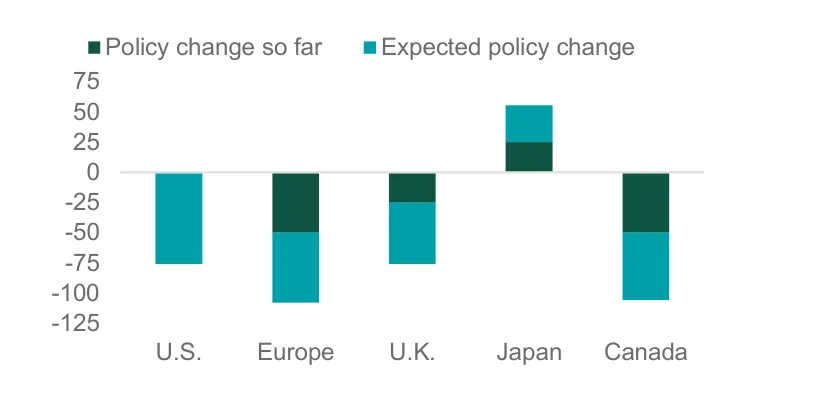
The central bank reaction functions have varied somewhat globally though with most major developed market central banks still on course to gradually ease policy aside from the Bank of Japan. Central banks have largely shied away from offering direct guidance in relation to rising uncertainty, while generally placing more emphasis on downside growth risks relative to upside inflation risks. The Federal Reserve left policy unchanged in the quarter, while the European Central Bank cut twice and the Bank of England cut once.
2025 Central Bank Activity (bps)
U.S. Equities Lag in the Quarter
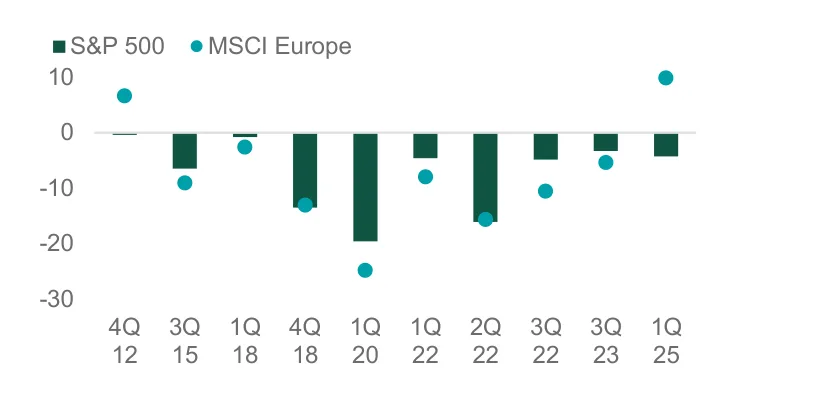
The biggest shift in the market backdrop was the underperformance of the U.S. equity markets versus the rest of the world. The confluence of a less-positive outlook for U.S. megacap tech following DeepSeek AI news and broader U.S. policy uncertainty led to notable headwinds for U.S. indexes. U.S. equities reached a 10% correction from mid-February through mid-March while non-U.S. equities were closer to flat. European equities outpaced the U.S. by 15% in the quarter – one of the largest quarters of outperformance on record.
Last Ten Quarters with S&P 500 Losses (%)
Source: Bloomberg, Macrobond, Citi, Economic Policy Uncertainty, Matteo Iacoviello. Data as of 3/31/2025. First chart: one-month smoothed measures using daily data. Fourth chart: USD total returns. Past performance is not indicative or a guarantee of future results. Index performance returns do not reflect any management fees, transaction costs or expenses. It is not possible to invest directly in any index.
Market Review
Interest Rates
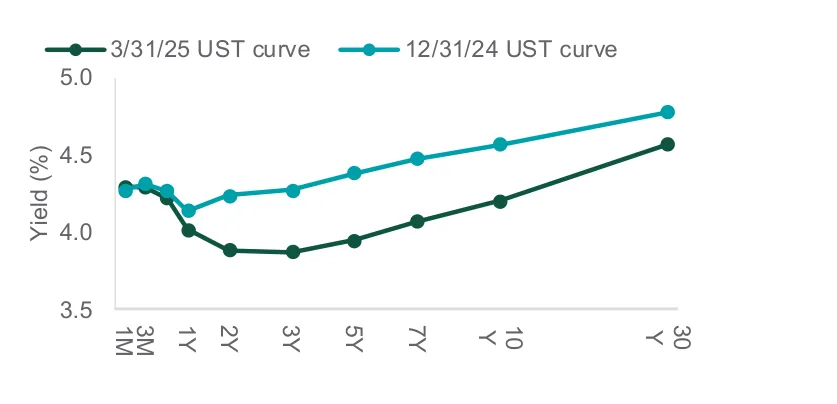
Policy uncertainty weighed on U.S. interest rates. Most of the move in longer-end Treasury yields was driven by lower real yields as market-based inflation expectations were mostly stable. These moves were not consistent globally. In fact, fiscal reform pushed up longer-end real yields in the Euro Area, while yields in Japan continued to rise. Globally, uncertainty was a consistent theme across central bank communications. The Fed slowed the pace of quantitative tightening while opting to leave rates unchanged with a dovish forward-looking posture.
U.S. Treasury Yield Curve
Credit Markets
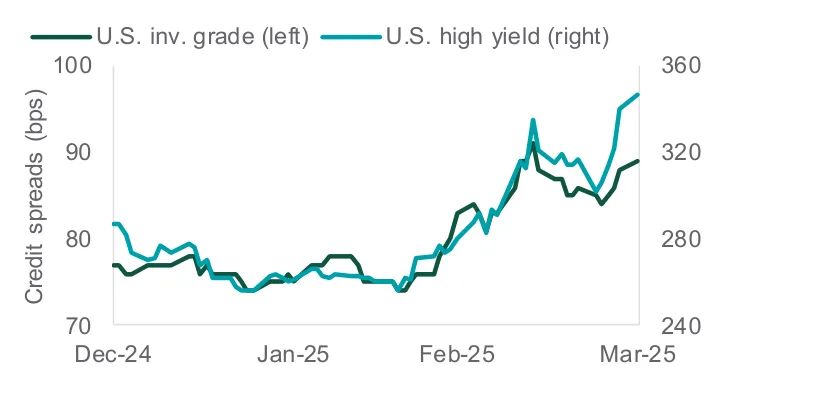
Investment grade (IG) spreads widened 12 bps to 0.89%. High yield (HY) spreads widened 60 bps to 3.47%. Weakness within HY was led by lower-rated credits, which marks a reversal from recent years in which lower-quality credits outperformed. However, overall credit fundamentals were mostly unchanged and spreads still remain below long-term averages. From a return lens, both IG and HY fixed income were positive with support from income yields. For diversified investors, most bonds helped buffer U.S. stock losses.
Credit Spreads
Equities
A significant shift in regional leadership trends left global equities down a percent. In dollar terms, Europe returned around 15% more than the U.S., while local currency returns were lower but still strong. China outperformed the U.S. by around 20% on fiscal support and a tech sector revival. U.S. exceptionalism is under pressure after the S&P 500 Index lost 4% and entered a 10% correction. Tech, growth and cyclical stocks produced outsized drag on overall index returns. The equal-weighted S&P index was down about 1%.
Regional Equity Indices
Real Assets
Real assets were another area of the market that provided diversification from U.S. equity market losses. Natural resources led the way with a 7% gain during the quarter, followed by listed infrastructure (+5%) and positive performance from global real estate (+1%) that was sensitive to interest rate movements. Gold made new highs with a 19% gain in the quarter, which brings its trailing one-year return to 40%. Inflation, a weaker U.S. dollar, economic uncertainty and central banks continuing to add to gold reserves were key supports.
Real Asset Indices
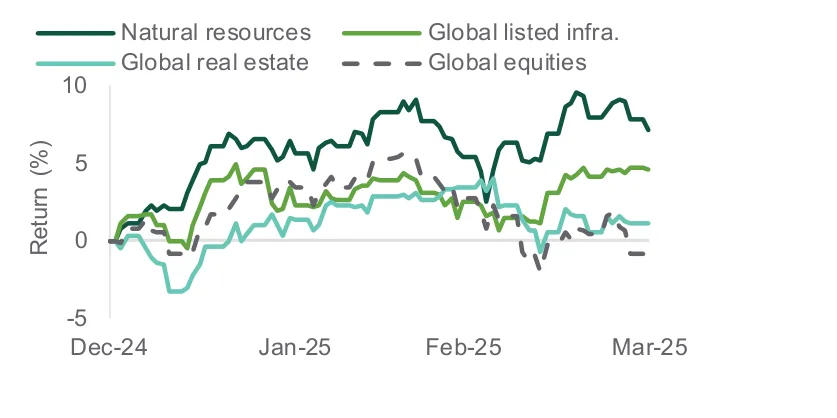
Source: Bloomberg. Returns in U.S. dollars. Indexes are gross of fees. Past performance is not indicative or a guarantee of future results. Index performance returns do not reflect any management fees, transaction costs or expenses. It is not possible to invest directly in any index.
Market Events

Key market events, January to March 2025
JANUARY
Republican representative Mike Johnson is reelected as House speaker during the first round of ballots. | |
U.K. bond and currency markets weaken on fiscal concerns. Longer dated gilt yields are now higher than the 2022 mini-budget crisis period. | |
Donald Trump is inaugurated as U.S. President for his second term. He signs a flurry of executive orders and mentions that tariffs are forthcoming. | |
DeepSeek launches its low-cost AI model, sparking ranging discussion about the extent of U.S. tech spending on AI-related capex. | |
The European Central Bank (ECB) implements a widely expected 25-basis-point (bp) rate cut to its three key interest rates, lowering the deposit rate to 2.75%. |
FEBRUARY
President Trump agrees to postpone U.S. tariffs on Mexican and Canadian imports until March to allow more time for negotiations. This comes days after Trump signed the executive order to impose the tariffs. | |
The U.S. Consumer Price Index prints hotter-than-expected, underscoring the bumpy nature of inflation. | |
In the January FOMC meeting minutes, the Fed communicates that it wants to see further progress on inflation before cutting. Trade and immigration policies are mentioned as risks. | |
The opposition conservatives led by Friedrich Merz win a lackluster victory in Germany’s election, with Merz set to become the next Chancellor. | |
Nvidia (NVDA) beats analysts’ earnings and revenue estimates. However, guidance and ongoing tariff risk fail to inspire investors. |
MARCH
Germany announces a massive fiscal spending program that allows defense spending to circumvent Germany’s debt brake and also includes a €500 billion infrastructure fund over 10 years. | |
China announced more fiscal stimulus to support domestic consumption and cushion against the impact of an escalating trade war. | |
The preliminary March University of Michigan consumer survey suggests consumers are more pessimistic and more worried about inflation. | |
U.S. President Donald Trump announces a 25% tariff on foreign auto imports scheduled to take effect on April 3. | |
The core Personal Consumption Expenditures Price Index is hotter-than-expected and rises to 2.8% year-over-year. |
IMPORTANT INFORMATION. This material is provided for informational purposes only. Current or prospective clients should under no circumstances rely upon this information as a substitute for obtaining specific legal or tax advice from their own professional legal or tax advisors. All material has been obtained from sources believed to be reliable, including Northern Trust Asset Management, Dimensional Fund Advisors, J.P. Morgan Asset Management, Blackrock, and Vanguard, but the accuracy, completeness and interpretation cannot be guaranteed. Information contained herein is current as of the date appearing in this material only and is subject to change without notice. Past performance is no guarantee of future results. Forward looking statements and assumptions are Investment Trust Company's current estimates or expectations of future events based upon research and should not be construed as an estimate or promise of results that a portfolio may achieve. Actual results and account activities could differ materially from the results indicated by this information.
For more information please contact:
Steven E. Post, CFP®
Senior Vice President
Director of Portfolio Management
Denver: 303.778.6800
Colorado Springs: 719.632.4677