Q2 2026 Review: From Shock to Recovery

Q2 2026 Review: From Shock to Recovery

October 14, 2026

From Shock to Recovery

After a difficult start to the year, equity markets rebounded sharply in the second quarter. One of the central focuses was the U.S.-Iran conflict and the prospect of reopening the Strait of Hormuz. News flow was often volatile, with reports of progress frequently interrupted by renewed tensions or conflicting comments. Despite the uneven path, markets increasingly priced in the view that a resolution would eventually emerge. As the probability of a reopening improved and negotiations advanced toward a memorandum of understanding, commodity prices retreated from their highs, helping ease concerns around both higher inflation and weaker global growth. The global economy proved more resilient than many anticipated.

Economic data generally held up well, particularly in the U.S., where consumer spending continued to expand, labor market conditions showed some signs of improvement, and technology capital expenditure was strong. The combination of resilient demand and easing energy pressures helped shift the balance of risks in a more constructive direction by quarter-end.

Against this backdrop, central banks signaled a bias toward a more restrictive policy posture. One of the more notable monetary policy developments came in the U.S., where Kevin Warsh's inaugural meeting as Chair of the Federal Reserve resulted in higher yields at the short-end of the Treasury curve. While policy rates were left unchanged, markets moved to price additional tightening and adjusted to Warsh's message that forward guidance would play a smaller role in future communications. Outside the U.S., policy paths were more mixed, but most major central banks enter the second half of the year with a more restrictive stance than at the start of 2026. The European Central Bank and Bank of Japan were among central banks delivering rate increases during the quarter.

Second Quarter 2026

In terms of financial market performance, equity markets significantly outperformed fixed income markets as investors looked through near-term geopolitical uncertainty and focused on strong earnings fundamentals. Corporate profit growth trended strongly across most major regions, allowing equities to generate outsized returns without a significant increase in valuation multiples.

The AI buildout continued to be a defining market theme. Persistent shortages in semiconductors and memory components, coupled with continued growth in technology investment, drove exceptional performance in AI-linked markets and sectors, including global semiconductors, Korea, emerging markets, and U.S. large-cap technology stocks.

Yet the advance was broader than just remarkable returns in those pockets of the markets. Financials, banks, and small cap equities also posted strong gains, reflecting confidence in the durability of economic and corporate profit growth. Nearly every U.S. large-cap sector outside energy and utilities finished the quarter in positive territory. By the end of the quarter, technology stocks started to experience some pressure, and leadership had begun to rotate from AI beneficiaries.

Second Quarter 2026 Total Returns (%)

Equities delivered an exceptionally strong quarter on the back of receding geopolitical risks and ongoing technology strength.

Second quarter 2026 and year-to-date total returns by asset class (%)
CategoryAsset class2Q 2026 (%)YTD 2026 (%)
Fixed Income
Cash
0.9
1.8
Fixed Income
Municipal bonds
2.5
2.3
Fixed Income
Investment grade bonds
0.7
0.6
Fixed Income
TIPS
0.9
1.2
Fixed Income
High yield bonds
2.5
2.0
Fixed Income
Emerging markets debt
3.9
1.5
Equities
U.S. equities
15.7
11.2
Equities
Developed ex-U.S. equities
10.1
9.3
Equities
Emerging markets equities
22.8
22.6
Real Assets
Natural resources (NR)
-8.5
9.7
Real Assets
Global real estate (GRE)
8.5
9.4
Real Assets
Global listed infrastructure (GLI)
1.6
10.0

Source: Northern Trust Asset Management, Bloomberg. NR: Natural Resources; GRE: Global Real Estate; GLI: Global Listed Infrastructure. Indexes are gross of fees. Past performance is not indicative or a guarantee of future results. Index performance returns do not reflect any management fees, transaction costs or expenses. It is not possible to invest directly in any index.

Key Developments

Growth Through the Shock

Despite one of the largest oil supply disruptions in history, oil markets and global growth proved notably resilient. While spot crude prices surged, longer-dated oil prices remained more contained, supported by existing supply buffers and confidence that disruptions would prove temporary. Amid higher headline inflation driven by energy prices, global growth remained firm, aided by reduced tariff uncertainty, accommodative financial conditions, U.S. consumer tax refunds, and continued strength in technology investment.

Price of Brent Crude Oil ($ per Barrel)
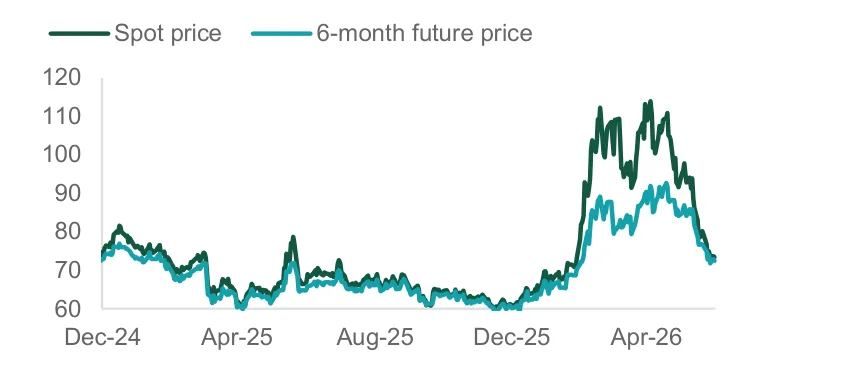
Line chart of the Brent crude oil spot price and the 6-month future price from December 2024 to April 2026. Both lines spike sharply late in the period, with the spot price surging above the 6-month future price, before falling back.

Higher for Longer

In the face of the energy shock, many central banks continued to maintain a more restrictive posture. The agreement to reopen the strait reduced market pricing of near-term inflation pressures, but elevated core inflation and the absence of major economic cracks kept expectations for rate hikes tilted upward. This was reinforced at June’s Fed meeting, where new Chair Kevin Warsh expressed a commitment to price stability and indicated that forward guidance will play a smaller role in shaping policy expectations than in the past.

2-Year Treasury Yield vs. Breakeven Inflation Rate (%)
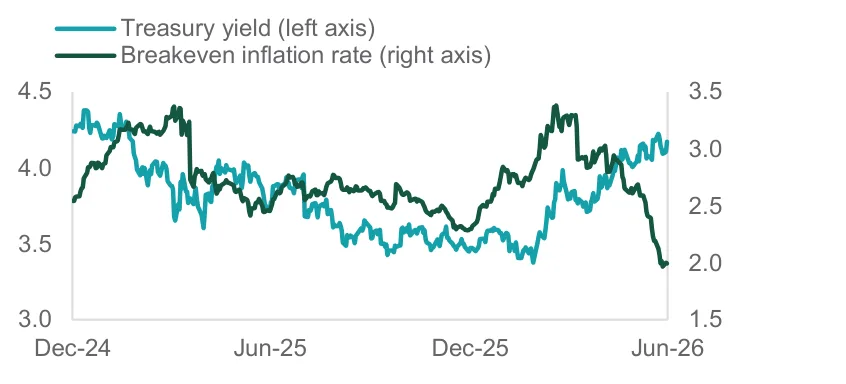
Line chart of the 2-year Treasury yield (left axis) and the breakeven inflation rate (right axis) from December 2024 to June 2026. The breakeven inflation rate drops sharply at the far right of the chart while the 2-year Treasury yield ends higher.

Profitability Beyond Economic Growth

While economic growth remained resilient, corporate earnings growth was particularly exceptional. The gap between U.S. large cap profit growth and economic activity widened to one of its largest levels in decades, a dynamic more commonly seen during recoveries. This cycle has been different, with AI-related profits proving more structural than cyclical in nature. Although many sectors posted gains, the AI ecosystem was the primary driver of above-average earnings growth and the key engine behind the quarter’s outsized equity returns.

Standardized Y/Y Change in U.S. GDP and EPS
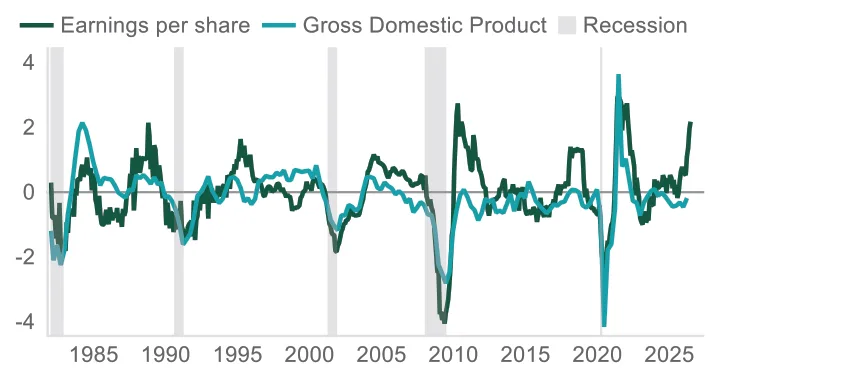
Line chart of the standardized year-over-year change in U.S. earnings per share and gross domestic product from the 1980s to 2025, with shaded recession periods. Earnings per share climbs well above GDP growth at the far right of the chart, matching the widening gap described in the text.

Financing Innovation

The IPO market came back to life with the SpaceX listing and other potential mega offerings (i.e., OpenAI, Anthropic). If these deals come to market, issuance volumes could reach historic levels. While the size may be manageable relative to overall market capitalization, they reflect a broader trend: the high capital needs of next-generation technologies. From equity issuance and debt financing to index concentration and corporate fundamentals, the innovation buildout is reshaping how investors evaluate markets and allocate capital.

U.S. Initial Public Offering (IPO) Volumes by Year
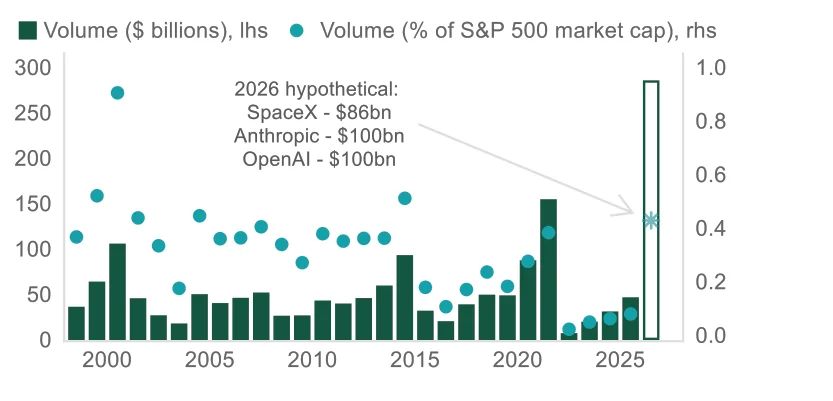
Combined bar and dot chart of U.S. IPO volumes by year from 2000 to 2026, with bars showing volume in billions of dollars and dots showing volume as a percent of S&P 500 market cap. A callout labeled 2026 hypothetical lists SpaceX - $86bn, Anthropic - $100bn and OpenAI - $100bn.

Source: Northern Trust Asset Management, Bloomberg, Macrobond. Data as of 6/30/2026. Note: EPS (earnings per share) is for the S&P 500 Index (third chart); 2026 hypothetical estimates from ASR (fourth chart). Past performance is not indicative or a guarantee of future results. Index performance returns do not reflect any management fees, transaction costs or expenses. It is not possible to invest directly in any index.

Market Review

Interest Rates

The 2-year Treasury yield rose 38 basis points (bps), significantly outpacing the 15-bp increase in the 10-year yield. The 10-year Treasury yield climbed through mid-May, peaking just below 4.7% alongside the peak in oil prices before retreating to under 4.5% by quarter-end as concerns surrounding the U.S.-Iran conflict eased. Beyond the energy shock, economic resilience allowed central banks to maintain a hawkish stance. While the Fed remained on hold, markets shifted from pricing 7 bps of cuts to 38 bps of hikes by year-end.

U.S. Treasury Yield Curve
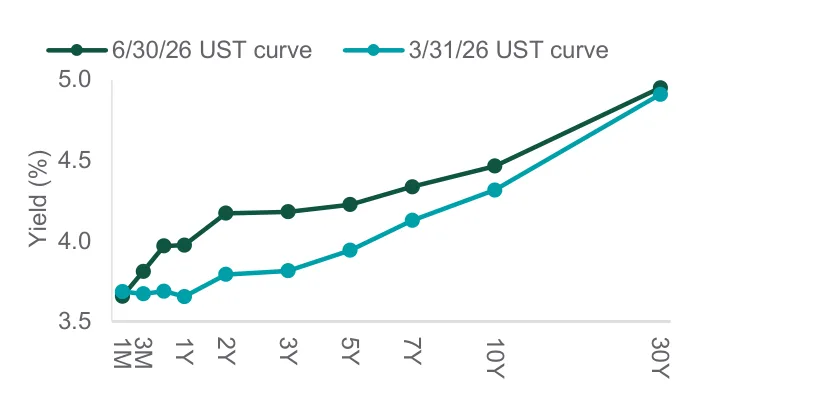
Line chart comparing the U.S. Treasury yield curve on 6/30/26 with 3/31/26 across maturities from 1 month to 30 years. The 6/30/26 curve sits above the 3/31/26 curve at shorter maturities, with the gap narrowing to almost nothing at 30 years.

Credit Markets

Investment grade (IG) credit spreads contracted 14 bps to 0.69%, while high yield (HY) spreads tightened 47 bps to 2.70%. IG bonds returned 0.7%, and high yield gained 2.5%. Although U.S. interest rates moved higher, the drag was more than offset by starting yields and spread tightening for bonds with exposure to credit risk. After facing pressure in the first quarter from higher energy prices and AI-related concerns, credit spreads spent most of the second quarter retracing those moves, ending not far from record lows.

Credit Spreads
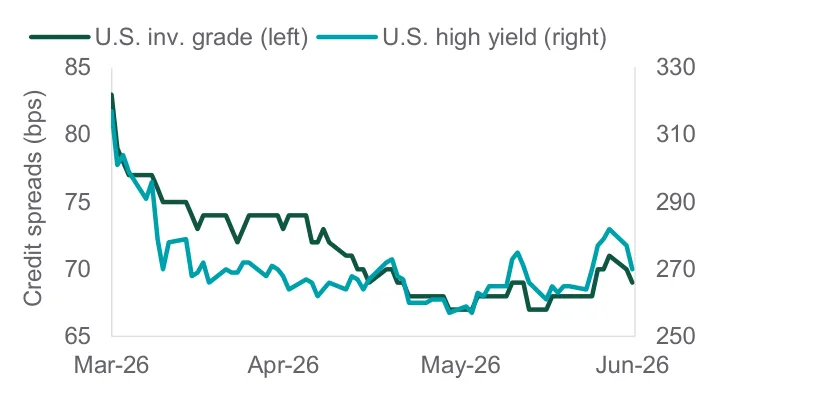
Line chart of U.S. investment grade (left axis) and U.S. high yield (right axis) credit spreads in basis points from March to June 2026. Both spreads are highest at the start of the period and trend lower through June.

Equities

Similar to oil futures, equities traded ahead of both the peak in spot oil prices and the formal reopening of the Strait of Hormuz. Global equities gained 15% during the quarter, approximately 1.5 standard deviations above their 30-year average. While U.S.-Iran de-escalation helped, technology stocks led the advance on the back of remarkable semiconductor strength. This led to outsized gains in tech-heavy markets such as Korea (+68%) and contributed to the outperformance of U.S. and emerging markets relative to developed ex-U.S.

Regional Equity Indices
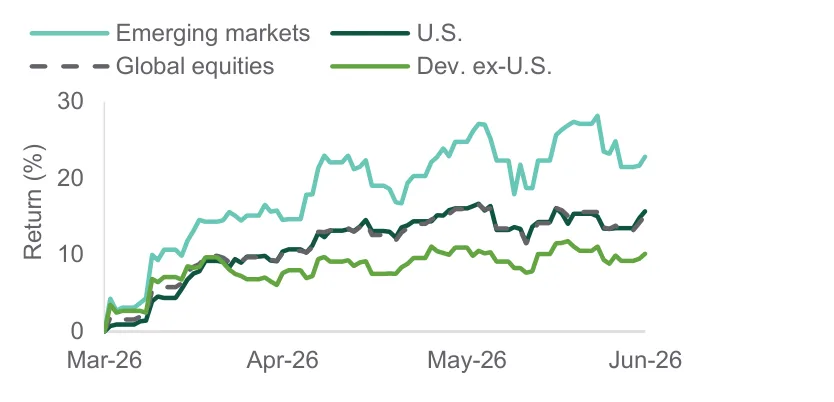
Line chart of cumulative returns for emerging markets, global equities, the U.S. and developed ex-U.S. from March to June 2026. All four rise over the period, with emerging markets highest and developed ex-U.S. lowest.

Real Assets

Real assets exhibited significant dispersion during the quarter. Global real estate gained 8.5%, followed by a 1.6% return for global listed infrastructure, while natural resources declined 8.5%. All three lagged global equities (15.1%). Natural resources was the clear underperformer after returning 20% in Q1, trading largely sideways before selling off in late May as commodity prices fell 14% from that point through quarter-end. Despite the volatile path, all three real asset categories remain up roughly 10% year-to-date.

Real Asset Indices
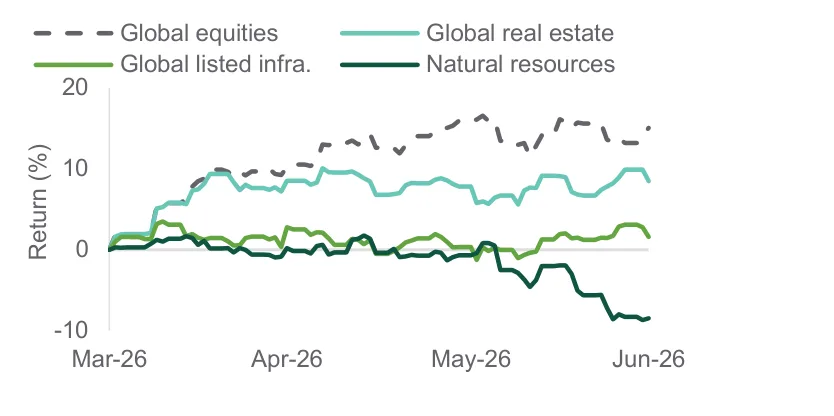
Line chart of cumulative returns for global equities, global real estate, global listed infrastructure and natural resources from March to June 2026. Global equities finish highest, and natural resources fall below zero by the end of June.

Source: Bloomberg. Returns in U.S. dollars. Indexes are gross of fees. Past performance is not indicative or a guarantee of future results. Index performance returns do not reflect any management fees, transaction costs or expenses. It is not possible to invest directly in any index.

Notable Market Events During the Quarter
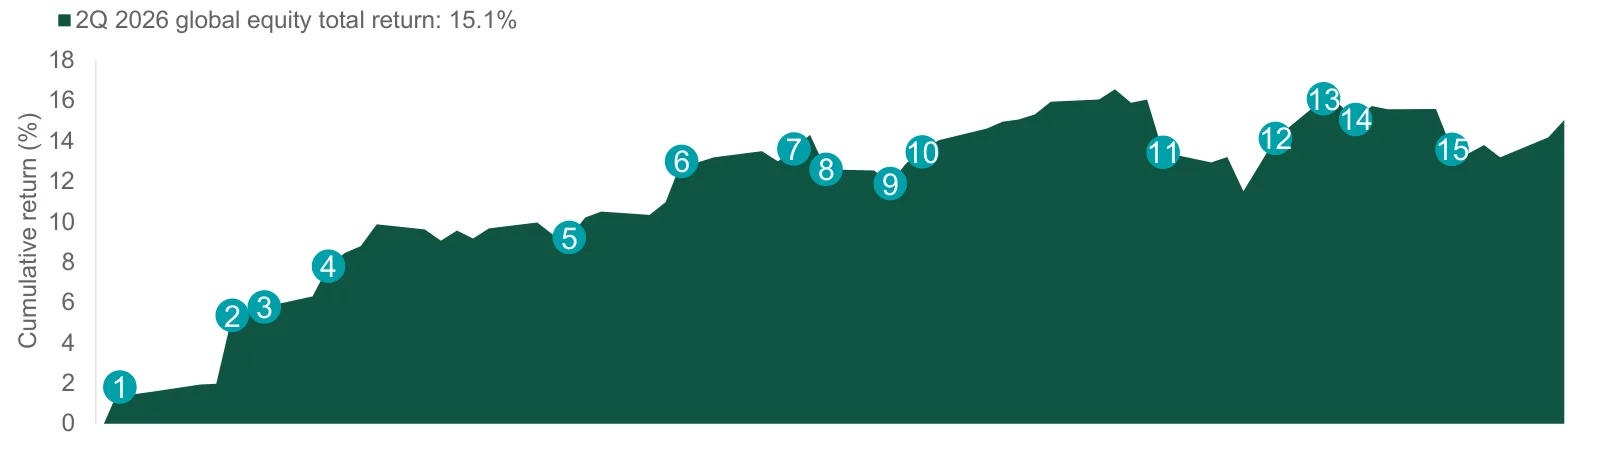
Area chart of the cumulative global equity total return during the second quarter of 2026, with numbered markers 1 to 15 for the notable market events listed below. The cumulative return climbs from near zero in early April to finish the quarter at 15.1%.

APRIL

1
A 35-nation coalition weighed a push to persuade Iran to open the Strait of Hormuz, partially unwinding the war premium in oil prices.
2
A Pakistan-brokered U.S.-Iran ceasefire reduced near-term Hormuz closure risk, driving the quarter's largest single-day rally.
3
March U.S. CPI posted its sharpest annual rise in four years, fully pricing out 2026 Fed cuts.
4
The U.S. launched a formal Hormuz naval blockade and oil surged above $100 per barrel.
5
Powell's final FOMC produced four dissents — the most in 34 years — as the Fed remained on hold.

MAY

6
Advanced Micro Devices (AMD) surges 19% as data center spending helped drive above-consensus revenue and guidance during its first-quarter earnings release.
7
April PPI hit its fastest pace since 2022 while the 10-year Treasury yield rose to its highest level since July.
8
Brent oil hit $123 per barrel on its ninth consecutive daily gain.
9
The 30-year Treasury yield hit 5.18% — its highest since 2007 — as investors considered inflation, economic resilience and a rising term premium.
10
Nvidia guided Q2 revenue higher, prompting widespread analyst upgrades and reinforcing the AI supercycle thesis.

JUNE

11
May payrolls intensified pressure on the Fed to hike. Tech stocks sold off, contributing to one of several circuit-breaker events in South Korea during a very robust but volatile quarter.
12
SpaceX's record IPO surged 19% on debut, lifting U.S. equity issuance.
13
The U.S. and Iran reached a peace deal, leading to lower oil prices and interest rates, while pushing equities higher.
14
Fed President Kevin Warsh's inaugural FOMC abandoned forward guidance and vowed price stability, prompting Treasury curve flattening.
15
Tech stocks sold off, leading to the quarter's worst single-day drop for global equities. Equities still proceeded to finish the quarter up a robust 15%.

Source: Bloomberg. Returns in U.S. dollars. Indexes are gross of fees. Past performance is not indicative or a guarantee of future results. Index performance returns do not reflect any management fees, transaction costs or expenses. It is not possible to invest directly in any index.

IMPORTANT INFORMATION. This material is provided for informational purposes only. Current or prospective clients should under no circumstances rely upon this information as a substitute for obtaining specific legal or tax advice from their own professional legal or tax advisors. All material has been obtained from sources believed to be reliable, including Northern Trust Asset Management, Dimensional Fund Advisors, J.P. Morgan Asset Management, Blackrock, and Vanguard, but the accuracy, completeness and interpretation cannot be guaranteed. Information contained herein is current as of the date appearing in this material only and is subject to change without notice. Past performance is no guarantee of future results. Forward looking statements and assumptions are Investment Trust Company's current estimates or expectations of future events based upon research and should not be construed as an estimate or promise of results that a portfolio may achieve. Actual results and account activities could differ materially from the results indicated by this information.

For more information please contact:

Steven E. Post, CFP®
Senior Vice President
Director of Portfolio Management

Denver: 303.778.6800

Colorado Springs: 719.632.4677

sep@investmenttrust.com

www.investmenttrust.com