Quarterly Report

4Q25

HIDDEN CURRENTS, STEADY TIDES

Resilience through the fog. For most of the final quarter of 2025, the macroeconomic landscape was shaped as much by what investors couldn’t see as by what they could. The U.S. government shutdown—lasting a record 43 days—created a significant information vacuum just as markets sought clarity on growth, inflation, and policy trajectories. Despite the data fog, the global macro backdrop proved “good enough” for risk assets. Global growth held firm, inflation stayed sticky but avoided more disruptive outcomes, and most central banks leaned more accommodative than hawkish. In the U.S., elevated downside labor market risk kept Fed easing in play, leading to rate cuts even as the economy expanded. However, policymaker dissents emerged as the Fed Funds rate approached the Federal Open Market Committee’s neutral estimate. International markets— particularly Japan and parts of Europe—offered broadly supportive signals, though political uncertainty occasionally weighed on European sentiment. Overall, the global tariff environment proved less disruptive than earlier fears. U.S. monthly tariff collections rose but remained well below levels implied by announced policies, while statutory rates edged lower as deals and exemptions took hold. Still, investors monitored persistent trade-related risks alongside other potential headwinds, including slower AI investment, labor market softening, bond market volatility tied to inflation or fiscal stress, and ongoing risk of geopolitical shocks.

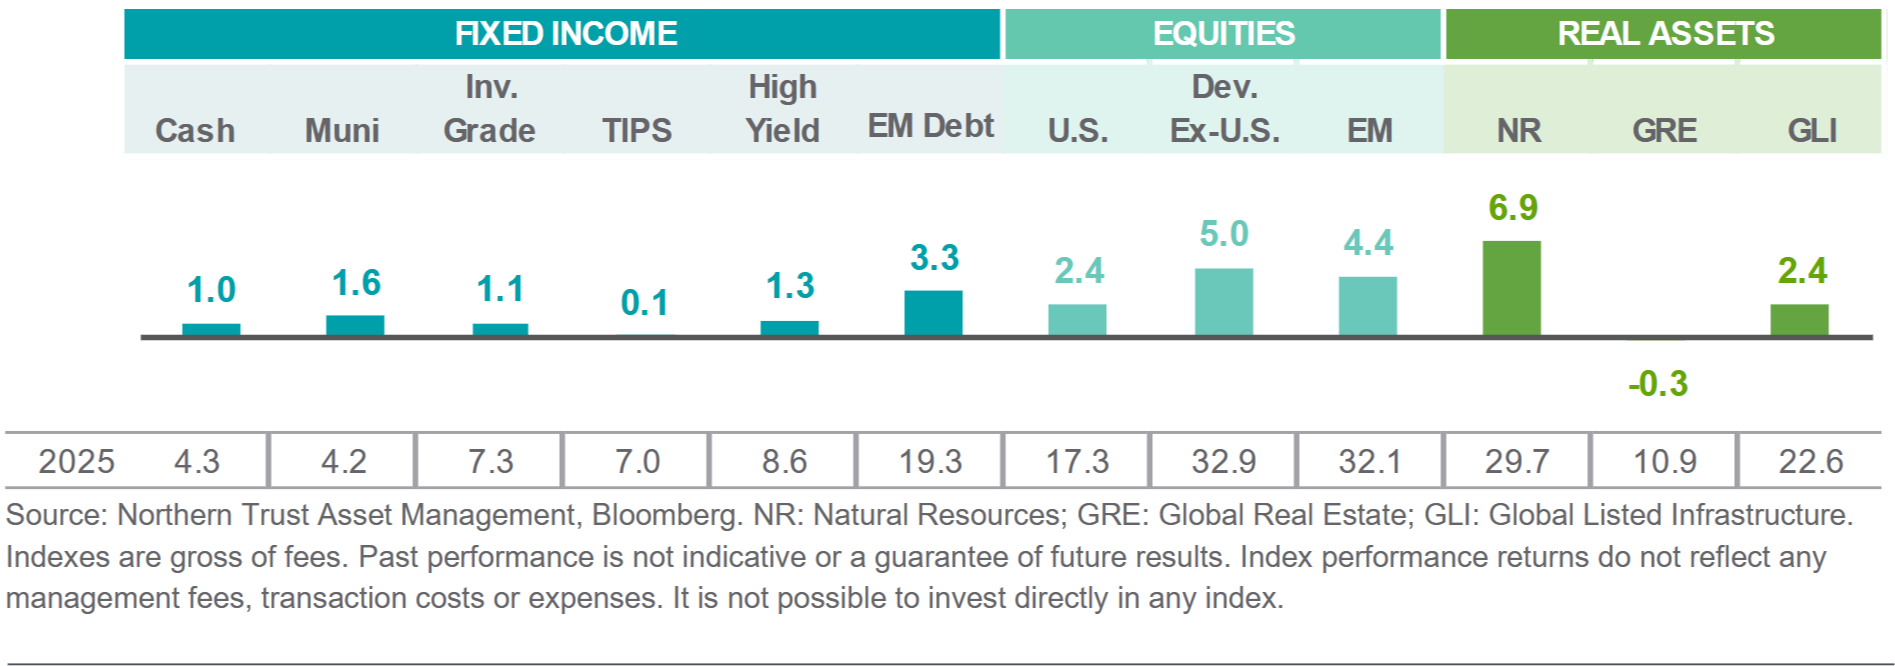
Markets end 2025 on a good note. Financial markets capped a strong 2025 with 4Q gains across both equities and fixed income. Many fixed income segments gained around 1%. The Treasury yield curve steepened as short- end rates dropped following multiple Fed rate cuts in the quarter. Credit spreads were mostly unchanged in both investment grade and high yield, ending near their lowest levels in 2025. Global equities added a little more than 3% as non-U.S. regions outperformed the U.S. in U.S. dollar terms (despite slight U.S. dollar strengthening). U.S. equity returns were positive (roughly 2.5%) in a fairly wide- ranging manner – leaving the equal-weighted S&P 500 up just under 1.5%. Across sectors, healthcare led with a 12% gain, while consumer staples (flat) and utilities and real estate (low-single-digit losses) lagged. A strong 3Q2025 corporate earnings season helped bolster the earnings outlook heading into 2026. Both megacap tech and broader AI-adjacent equities were all over the map in 4Q, generally positive on average but with notable winners and losers. Initial broad investor enthusiasm over AI- related investment news gave way to more scrutiny on the potential returns of such investments. Overall, the Mag 7 contributed around 42% of the 18% 2025 gain for the S&P 500; less than the roughly 55-60% contributions in 2023 and 2024. International equities gained around 5% in 4Q, with both non-U.S. developed and emerging markets returns topping 30% in U.S. dollar terms for 2025. Real assets performance was modestly positive, led by a 7% gain for natural resources. Surging metals prices helped support the natural resources complex: gold, silver and copper prices were all up double-digits in the quarter.

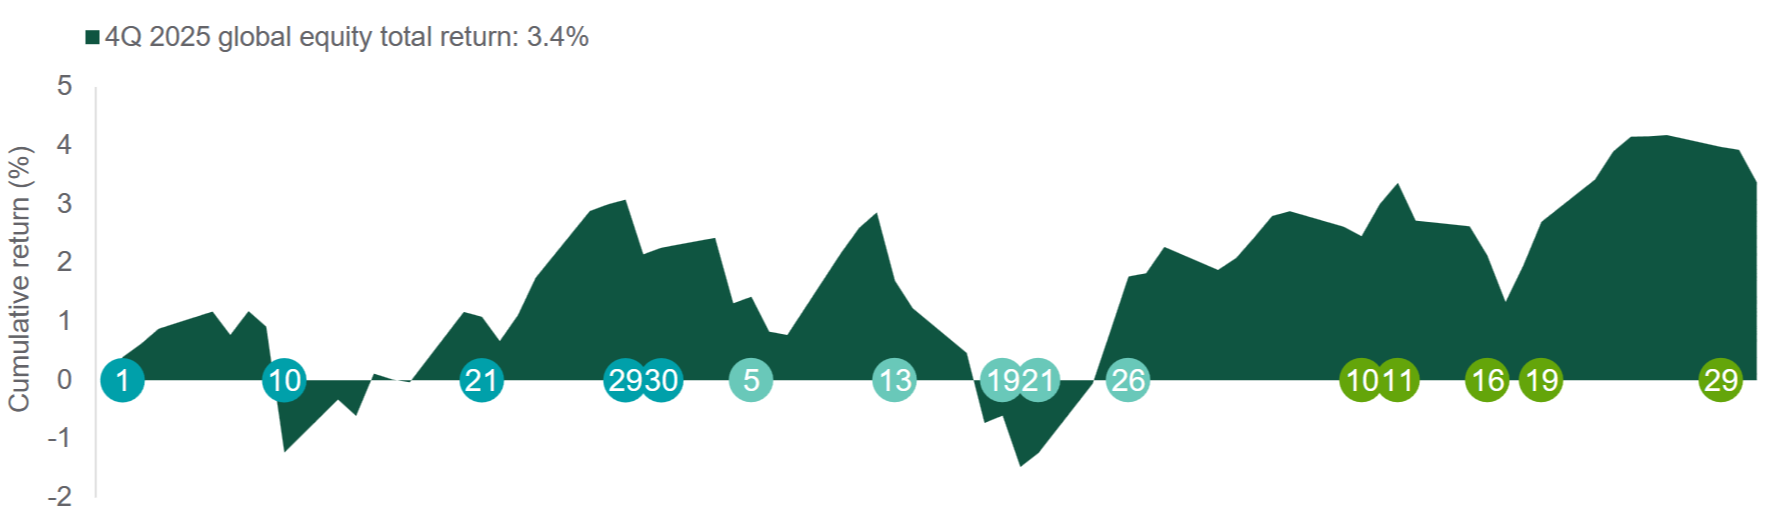
FOURTH QUARTER 2025 TOTAL RETURNS (%)

Global equities gained several percent during the quarter, capping off the third year in a row of +15% returns.
KEY DEVELOPMENTS

U.S. Economic Resilience Amid Data Fog

Commencing at the start of the fourth quarter, the U.S. government shutdown lasted through mid-November. The U.S. economy avoided major broader disruption but the six-week shutdown hampered economic data collection. Resumed economic data took longer to materialize than initially expected with some noisy and incomplete data reports for the labor market and inflation. Overall, the broader narrative around the U.S. macroeconomic backdrop remained intact with ongoing resilience amid a gradually cooling labor market.

CHANGE IN NONFARM PAYROLLS (THOUSANDS)

Ebbing Tariff Policy Uncertainty

Policy uncertainty eased overall in 4Q, especially with respect to tariffs. Aggregate economic impacts from tariffs have been less disruptive than initially expected earlier in the year. The level of monthly collected tariffs continues to rise but is noticeably below the level based on announced policies – implying a tariff rate of around 11% (actual collections) versus 17% (announced tariffs). On the other hand, tariff impacts continue to filter through heading into 2026 and a reciprocal tariff- related Supreme Court case remains underway.

U.S. WEIGHTED AVERAGE TARIFF RATE (%)

Central Bank Easing Continued in 2025

Amid downside labor market risk, the Fed eased twice in 4Q. Diverging views across Fed policymakers have limited the extent of rate cuts expected by investors in 2026 (currently two). Since mid-2024, most major developed market central banks have cut rates by 150- 200 basis points or more, meaning some could be close to the end of their easing cycle. The Bank of Japan remains on a separate trajectory with a gradual pace of rate hikes from a highly accommodative starting point, including two in 2025 and two more expected in 2026.

2024-2026 CENTRAL BANK ACTIVITY (BPS)

Sorting Through AI Winners & Losers

Artificial intelligence (AI) remained a central market topic throughout 4Q. Initial focus on outsized AI-related investments gave way to investors taking a more critical eye at the sustainability and potential returns of AI- related investment plans. This led to wider variation in performance across both the largest tech-related companies and the broader AI complex. Most of the largest tech companies continue to have strong overall balance sheets and profitability, but investor scrutiny is likely to continue around cash flows and debt financing.

RETURNS (%)

Source: Northern Trust Asset Management, Bloomberg, U.S. Bureau of Labor Statistics, U.S. Census Bureau, Budget Lab at Yale. Data as of 12/31/2025. Note: bps = basis points, avg. = average. Past performance is not indicative or a guarantee of future results. Index performance returns do not reflect any management fees, transaction costs or expenses. It is not possible to invest directly in any index.

MARKET REVIEW

Interest Rates

The Fed continued easing, delivering 25‑basis‑point cuts at each of its two meetings. However, an increase in hawkish dissents and adjustments to the policy statement signaled a higher threshold for future reductions. Even so, ongoing easing contributed to further steepening of the Treasury curve, as front‑end yields through five years moved lower. The 2‑year yield ended the quarter at 3.47%, down 14 basis points (bps). In contrast, longer‑term rates remained more resilient, with the 10‑year yield up 2 bps to 4.17%.

U.S. TREASURY YIELD CURVE

Credit Markets

Investment grade (IG) credit spreads widened by 3 bps to 0.73%, while high‑yield (HY) spreads tightened by 1 bp to 2.66%. In terms of return, IG fixed income gained 1.1%, with high yield slightly outperforming at 1.3%. Periods of short-lived weakness followed by a strong recovery mirrored the pattern seen throughout most of the year. As a result, credit spreads enter 2026 below where they began 2025 across many quality buckets. Fundamentals continue to look healthy, but AI-related capex is helping to accelerate corporate debt issuance.

CREDIT SPREADS

Equities

Global equities closed out a strong year with a 3.4% return in the quarter. Valuations edged lower, meaning that earnings growth remained the primary driver of equity gains. Non‑U.S. equities outpaced the U.S., led by Europe and Latin America. In the U.S., more value‑oriented stocks outperformed large‑cap growth, reversing earlier year‑to‑date trends. Tech stocks finished the quarter higher but came under more scrutiny as investors increasingly differentiated between the likely winners and losers in the evolving AI complex.

REGIONAL EQUITY INDICES

Real Assets

There was notable dispersion among real asset indices. Natural Resources delivered a strong 6.9% gain, while Global Real Estate slipped 0.3%. Global Listed Infrastructure landed in between, returning 2.4%, which was modestly below global equities. Strength in Natural Resources was driven largely by metals, as has been the case throughout the year: gold rose another 12%, and silver surged more than 50%. Global Real Estate remained out of favor, weighed down by weakness in the office and data‑center property sectors.

REAL ASSET INDICES

Source: Bloomberg. Returns in U.S. dollars. Indexes are gross of fees. Past performance is not indicative or a guarantee of future results. Index performance returns do not reflect any management fees, transaction costs or expenses. It is not possible to invest directly in any index.

Market Events

OCTOBERNOVEMBERDECEMBER
1
U.S. government shutdown begins.
5
Oral arguments begin in the Supreme Court IEEPA (International Emergency Economic Powers Act) tariff case.
10
The Fed cuts rates by 25 basis points with three dissents and the updated dot plot shows one rate cut in 2026.
10
U.S.-China trade tensions escalate with threats around rare earth exports (China) and higher tariffs (U.S.); S&P 500 declines about 3%.
13
The U.S. government reopens after President Trump and Congress reach agreement on short-term funding bill.
11
Oracle (ORCL) declines more than 10% following concerns around AIrelated spending plans in its earnings release.
21
Sanae Takaichi becomes Japan’s first female Prime Minister, with plans for targeted fiscal spending following support from new coalition partner.
19
Nvidia (NVDA) earnings top expectations overall; but stock price ends 3% lower on the day following the release.
16
Combined November and October jobs report reflects continued gradual cooling in the labor market; the unemployment rate moves up to 4.6%
29
The Fed cuts rates by 25 basis points for the second consecutive meeting with two dissents (one for a larger cut, one for a hold).
21
Comments from New York Fed President Williams lead to increased market expectations for a December Fed rate cut.
19
The Bank of Japan raises rates to 0.75%, marking its second rate hike of 2025.
30
A one-year U.S.-China trade truce is announced including a pause on China rare earth export restrictions and reduced U.S. tariffs on China.
26
In a glitchy release, the U.K. Autumn Budget includes tax hikes and increased fiscal headroom; Gilt yields end lower on the day.
29
Metals prices see large one-day drop following a stretch of strong gains. Gold and silver both end up finishing 2025 with 50%-plus gains.

IMPORTANT INFORMATION. This material is provided for informational purposes only. Current or prospective clients should under no circumstances rely upon this information as a substitute for obtaining specific legal or tax advice from their own professional legal or tax advisors. All material has been obtained from sources believed to be reliable, including Northern Trust Asset Management, Dimensional Fund Advisors, J.P. Morgan Asset Management, Blackrock, and Vanguard, but the accuracy, completeness and interpretation cannot be guaranteed. Information contained herein is current as of the date appearing in this material only and is subject to change without notice. Past performance is no guarantee of future results. Forward looking statements and assumptions are Investment Trust Company's current estimates or expectations of future events based upon research and should not be construed as an estimate or promise of results that a portfolio may achieve. Actual results and account activities could differ materially from the results indicated by this information.

For more information please contact:


Steven E. Post, CFP®
Senior Vice President
Director of Portfolio Management


Denver: 303.778.6800

Colorado Springs: 719.632.4677


sep@investmenttrust.com

www.InvestmentTrust.com